The key to profiting from market panic isn’t timing the bottom, but executing a pre-planned strategy based on quantifiable fear metrics.
- Market overreactions are systemic; quality assets can drop 40% when their underlying business fundamentals have barely changed.
- A “Fear Index” (VIX) level above 40 has historically signalled prime buying opportunities with significant one-year returns.
Recommendation: Build your watchlist of fundamentally sound companies now, and use volatility spikes as your non-negotiable trigger to deploy cash.
The sound of a market crash is, for most people, the sound of fear. It’s a frantic signal to flee, to sell, to preserve what’s left. But for a small group of contrarian investors—for the distressed asset hunter—that sound is the starting gun. It signals the beginning of the hunt for premier assets at once-in-a-decade prices. While the crowd is driven by emotion, the hunter operates on a cold, calculated strategy designed to weaponise that very fear.
Common advice tells you to simply “stay calm,” “think long-term,” and perhaps “dollar-cost average” your way through the turmoil. These are passive, defensive platitudes designed for survival. But they are not a strategy for thriving. True opportunity lies not in weathering the storm, but in sailing directly into it with a clear map and a specific destination. This requires moving beyond generic advice and adopting a playbook built on understanding the mechanics of panic, proactively identifying targets, and using quantifiable triggers to act with precision.
This is not about reckless gambling or catching a falling knife without a plan. It is the exact opposite. It is a disciplined methodology for separating temporary panic from permanent problems, allowing you to acquire shares in excellent businesses at a significant discount, precisely because the market has temporarily lost its mind. The greatest transfers of wealth occur when assets move from the panicked to the prepared.
This guide provides the complete playbook for the distressed asset hunter. We will explore why quality assets become so cheap, how to build your target list, how to differentiate a bargain from a trap, and finally, the specific signals that tell you when to deploy your capital.
Summary: The Distressed Asset Hunter’s Playbook
- Why Quality Assets Fall 40% During Crises When Fundamentals Change 10%?
- How to Create a “Wish List” of Stocks to Buy When Prices Crash?
- Crashed Stocks or Forced Property Sales: Which Distressed Asset Offers Better Returns?
- The Bargain Stock Trap That Never Recovers From Its 50% Drop
- When to Deploy Cash Into Falling Markets: The Fear Index Trigger
- Why Selling Investments During a Crisis Costs the Average Household £12,000?
- When to Increase Emerging Market Exposure: The P/E Ratio Signal
- How to Access 50 Countries’ Growth With a Single Global Equity Fund?
Why Quality Assets Fall 40% During Crises When Fundamentals Change 10%?
The central paradox of a market panic is the profound divergence between price and value. An excellent company, whose long-term earnings power has been minimally impacted, can see its stock price slashed by 30%, 40%, or even more. This isn’t rational; it’s mechanical. The reason lies in understanding that major market crashes are often not a reflection of a sudden, drastic deterioration in business fundamentals, but rather a result of the market’s own internal instability.
These crashes are frequently endogenous, meaning they are born from within the market system itself. The external event—be it a pandemic, a credit crunch, or a geopolitical shock—is merely the spark that ignites a pre-existing tinderbox of leverage, herd behaviour, and automated selling. As fear takes hold, margin calls are triggered, forcing investors to sell good assets to cover losses on bad ones. Index funds and ETFs, forced to track their underlying basket, become indiscriminate sellers, pushing down the prices of all constituent stocks regardless of their individual merit.
Case Study: The 2020 Global Stock Market Crash
An analysis of 10 major world stock indexes during the COVID-19 crash found that the collapse in most markets, including the S&P 500 and NASDAQ, was driven by systemic instability that had been building up long before the virus became a global headline. The crash stemmed from the increasingly unstable nature of the markets themselves, not from a fundamental overnight collapse in the business world. This confirms that the external shock was a trigger for an existing vulnerability, creating the massive price-value gap that opportunistic investors seek.
This mechanical, emotion-driven selling is what creates the discount. You are not buying a broken company; you are buying a perfectly good company that has been marked down by a temporarily irrational market. Understanding this distinction is the foundation of contrarian investing. You are betting on the eventual return of rationality, and a market panic is what gives you a compelling price to make that bet.
How to Create a “Wish List” of Stocks to Buy When Prices Crash?
An opportunist does not scramble for ideas during a crisis; the homework is already done. The key tool for a distressed asset hunter is a “wish list”—a curated list of exceptional companies you would be thrilled to own at the right price. This list is not about finding what is cheap today, but about identifying what is good and waiting for a market-wide panic to make it cheap. Preparation is what separates the hunter from the hunted.
Building this list requires a focus on durable, non-negotiable fundamentals. Your criteria should be ruthless and centred on survivability and long-term competitive strength. Look for companies with:
- A Wide Competitive Moat: Does the company have a durable advantage, like a strong brand, network effects, or high switching costs, that protects it from competition?
- A Fortress Balance Sheet: This means more than just a positive book value. Specifically, look for low levels of debt (e.g., a debt-to-equity ratio below 0.5) and a strong cash position. The company must be able to survive a prolonged downturn without needing to raise capital at dilutive prices.
- Consistent Free Cash Flow: Profits can be manipulated, but cash is king. A history of generating strong, positive free cash flow demonstrates a healthy, self-sustaining business model.
- A Business You Understand: You must be able to explain what the company does and how it makes money in a few simple sentences. Complexity is the enemy of the value investor.
This methodical preparation is the antidote to emotional decision-making. The goal is to build a list of 10-15 “no-brainer” businesses so that when the market is in freefall, your decision is not “what to buy?” but simply “is it cheap enough yet?”.
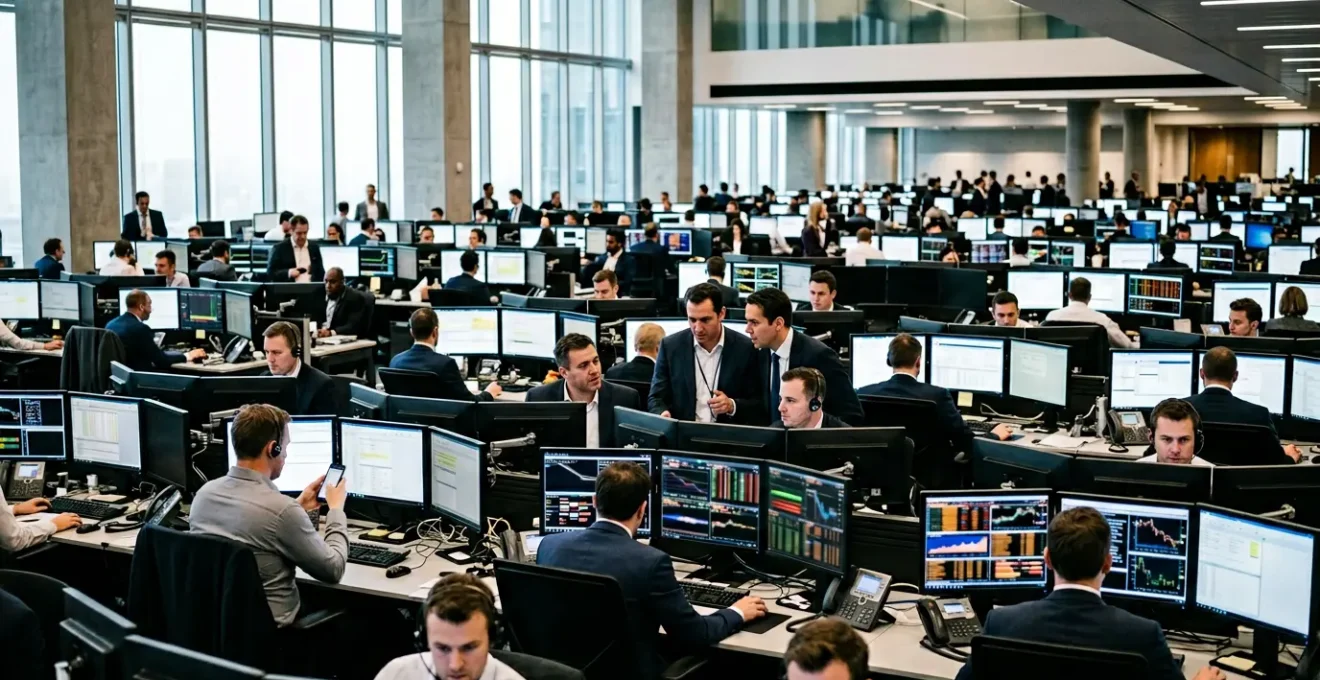
As the image suggests, this process is about deliberate analysis and strategic foresight. You are laying the groundwork for decisive action, ensuring that when the moment of opportunity arrives, your plan is already in place and ready to be executed without hesitation. This curated list is your primary weapon in exploiting market dislocations.
Crashed Stocks or Forced Property Sales: Which Distressed Asset Offers Better Returns?
During a broad economic crisis, distress appears in multiple asset classes. Forced property sales, where owners must liquidate quickly, can offer deep value. However, for the opportunistic hunter focused on capitalising on fear, crashed stocks offer several structural advantages, primarily centred on liquidity and speed. The window of maximum pessimism can be intense but brief, and the ability to act decisively is paramount.
Real estate is notoriously illiquid. The process of identifying a forced seller, conducting due diligence, arranging financing, and closing the transaction can take months. By the time a deal is finalised, the market sentiment may have already begun to recover, and a significant portion of the “panic discount” may have evaporated. Furthermore, transaction costs, including taxes, legal fees, and agent commissions, are substantial and eat into potential returns.
In contrast, public equity markets offer unparalleled liquidity. You can deploy significant capital in minutes, not months, with minimal transaction costs. This allows you to strike precisely when the fear is at its peak. More importantly, the recovery can be just as swift. While property markets can take years to bottom out and recover, stock markets have repeatedly shown their ability to rebound with surprising velocity.
Case Study: The Rapid COVID-19 Stock Market Recovery
The market crash in March 2020 provides a stark example. Global markets, including the S&P 500, plummeted over 30% in just a few weeks. However, investors who had the courage and capital to buy during this downturn saw their portfolios recover to previous levels within a year. As highlighted in a review of panic selling’s effects, many of those stocks went on to reach new all-time highs shortly after. This rapid V-shaped recovery demonstrated the immense potential of liquid equity markets, a speed that is simply unachievable in the slow-moving world of distressed real estate.
For the contrarian investor, the choice is clear. While property can be a solid long-term investment, the unique combination of deep, panic-driven discounts and the ability to act with surgical speed makes crashed stocks the superior hunting ground for capturing asymmetric risk-reward opportunities.
The Bargain Stock Trap That Never Recovers From Its 50% Drop
The single greatest danger for a distressed asset hunter is not overpaying; it’s buying a “bargain” that is actually on a terminal decline. This is the value trap: a stock that looks cheap on paper but continues to fall because its underlying business is fundamentally and permanently broken. A cheap stock is not the same as a good company on sale. Learning to tell the difference is a matter of survival.
The allure of a stock that has fallen 50% or 70% is powerful, but the data paints a sobering picture. Research has shown that a significant portion of the market’s cheapest stocks fail to generate positive returns. For instance, landmark research by Joseph Piotroski found that less than 44% of the cheapest stocks in the market manage to deliver a positive return over the subsequent two years. The majority are cheap for a very good reason—their business model is obsolete.
Even the most sophisticated investors can fall prey to this. When a company’s problems, initially perceived as temporary, reveal themselves to be part of a permanent structural shift, no price is low enough to make it a good investment.
Case Study: Warren Buffett’s Tesco Value Trap
In 2012, after UK retailer Tesco’s stock price had fallen, Warren Buffett increased his stake, believing he was buying a great business at a discount. However, Tesco was facing intense and growing competition from discount chains like Aldi and Lidl, a fundamental shift in the grocery landscape. The problems were not temporary. Buffett later admitted his mistake and sold his stake for a staggering £287 million loss, a powerful lesson that a falling price does not automatically signal value, even for a legendary investor.
To avoid this fate, your analysis must go beyond surface-level valuation metrics. You must conduct forensic analysis to spot the red flags of a business in decline.
Your Value Trap Detection Checklist
- Technological Disruption: Is the company failing to adapt to a fundamental industry change? (e.g., Kodak ignoring the shift to digital photography).
- Permanent Consumer Shift: Is declining demand a cyclical dip or a structural change in customer behaviour? (e.g., Sears focusing on financial engineering while retail moved online).
- Balance Sheet Death Spiral: Is the company servicing its debt by selling core assets or are its debt covenants at risk of being breached?
- Competitive Moat Erosion: Is the company consistently losing market share to nimbler competitors? This indicates a long-term decline, not a temporary setback.
- Failure to Innovate: Is the company’s R&D budget shrinking? This is a key signal that management has given up on competing for the future.
When to Deploy Cash Into Falling Markets: The Fear Index Trigger
The old adage “you can’t time the market” is often used to discourage investors from trying to buy at the bottom. But the distressed asset hunter isn’t trying to pinpoint the exact low. The goal is to identify periods of maximum pessimism, where the probability of positive forward returns is overwhelmingly high. This is not timing; it’s tactical deployment based on a quantifiable signal: fear.
The most reliable measure of market fear is the CBOE Volatility Index, or the VIX. Often called the “Fear Index,” the VIX measures the market’s expectation of 30-day forward volatility in the S&P 500. When the VIX is low, complacency reigns. When it spikes, panic is in the air. For the contrarian, a spiking VIX is not a reason to sell; it’s the dinner bell. It signals that institutional and retail investors are paying huge premiums for portfolio insurance (puts), a clear sign of extreme fear.
While any elevated VIX reading indicates nervousness, historical data points to a specific threshold that has consistently acted as a powerful buy signal. According to research from Wells Fargo, when the VIX climbs above 40, the S&P 500 has, on average, been up more than 30% one year later. Since 1990, stocks have risen over 90% of the time following such a spike. This is not a guarantee, but it provides a powerful, data-backed edge.
This is your trigger. Instead of relying on gut feeling or news headlines, you use a cold, hard metric. The strategy is simple: prepare your wish list of quality companies, and when the VIX screams past 40, begin deploying capital into those names. You may not catch the absolute bottom, but you are buying at a time when fear has created an asymmetric risk-reward profile heavily skewed in your favour.
Why Selling Investments During a Crisis Costs the Average Household £12,000?
The urge to sell when markets are plummeting is a powerful and deeply human one. It feels like the only way to stop the pain and “preserve capital.” In reality, it is the single most destructive action an investor can take. While a headline figure like a £12,000 loss on an average portfolio might capture the immediate hit of a downturn, the true, long-term cost of panic selling is orders of magnitude greater. It is the cost of missing the recovery.
Market downturns are temporary; the growth of great businesses over time is permanent. By selling during a panic, you are turning a temporary paper loss into a permanent, realised one. Worse, you are forfeiting your position for the inevitable rebound, which often happens faster and more furiously than anyone expects. The cost is not just the loss you lock in, but the massive gains you miss out on.
Long-term analysis makes this devastatingly clear. The difference in wealth creation between an investor who stays the course and one who tries to jump in and out of the market is staggering. A Morgan Stanley analysis demonstrates that an investor who stayed invested from 1980 through early 2025 with regular contributions would have accumulated millions more than one who sold after downturns and waited for the market to feel “safe” again before reinvesting. The “safety” they waited for was, in fact, the recovery they had just missed.
Case Study: The Cost of Panic Selling in the 2020 Crash
The COVID-19 recession provided a perfect, real-world stress test. As the S&P 500 fell over 33% and the Nasdaq dropped 30%, investors who sold in the panic of March 2020 locked in devastating losses. Meanwhile, those who simply held on (or, better yet, bought more) participated in one of the most powerful bull markets in history, as both indexes roared back to record highs through 2021 and early 2022. The lesson is clear: volatility is uncomfortable, but panic is catastrophic.
For the distressed asset hunter, this is the other side of the coin. Your entire strategy is predicated on buying the assets that these panic sellers are jettisoning. Their fear is the direct source of your opportunity.
When to Increase Emerging Market Exposure: The P/E Ratio Signal
The principles of distressed asset hunting are not confined to a single country or a handful of familiar blue-chip stocks. The greatest opportunities often lie where volatility is highest and investor sentiment is most fickle: Emerging Markets (EMs). During a global risk-off event, capital flees from regions perceived as higher risk, often creating extreme valuation discounts in markets with superior long-term growth prospects.
While the VIX is a great general market timer, a more specific valuation tool is needed to assess the opportunity in EMs. Here, the long-term price-to-earnings (P/E) ratio, particularly the Cyclically-Adjusted P/E (CAPE) ratio popularised by Robert Shiller, becomes an invaluable signal. The CAPE ratio smooths out earnings over a 10-year period to provide a clearer picture of long-term valuation, filtering out the noise of short-term economic cycles.
The trigger here is historical context. By analysing the long-term CAPE ratio for a broad emerging market index (such as the MSCI Emerging Markets Index), you can identify periods of extreme undervaluation. When the CAPE ratio falls significantly below its historical average—for instance, dropping into the single digits or approaching levels seen only during major past crises (like the Asian Financial Crisis or the 2008 Global Financial Crisis)—it signals that investors have priced in an excessive amount of pessimism.
This is the signal to increase exposure. You are not just buying cheap assets; you are buying into the long-term demographic and economic growth stories of dozens of countries at a price that assumes a worst-case scenario. When global panic pushes EM valuations to historical lows, it presents a generational opportunity to acquire future growth at a deep and irrational discount.
Key Takeaways
- Market panic causes a predictable divergence between price and fundamental value, creating the core opportunity for contrarian investors.
- Avoid value traps by checking for technological disruption and eroding competitive moats, not just relying on a low stock price.
- Use the VIX index as a tactical trigger: a reading above 40 has historically signalled periods of maximum fear and high forward returns.
How to Access 50 Countries’ Growth With a Single Global Equity Fund?
While hunting for individual distressed stocks offers the highest potential for alpha, it requires significant time, skill, and nerve. A simpler, yet immensely powerful, strategy for executing a contrarian approach is to buy the entire world when it’s on sale. This is achieved through a single global equity fund, a tool that simultaneously solves the problem of diversification and combats one of the most costly behavioural biases: home bias.
Home bias is the natural tendency for investors to overwhelmingly invest in their domestic market, even though it represents a tiny fraction of the global economy. A UK investor, for example, might have the vast majority of their portfolio in FTSE-listed companies, ignoring the immense growth happening in North America, Europe, and Asia. This lack of diversification exposes them to concentrated, country-specific risks without any commensurate reward.
Behavioural finance studies consistently show the high price investors pay for such errors. The long-running Dalbar’s Quantitative Analysis of Investor Behavior covering 1995-2024 shows that the average investor’s returns consistently and significantly underperform market index returns. This gap is largely due to behavioural mistakes like trying to time the market and a failure to properly diversify, often driven by home bias.
A single low-cost global equity tracker fund (for example, one tracking the MSCI All-Country World Index or FTSE Global All-World Index) is the perfect antidote. With one purchase, you gain ownership in thousands of companies across more than 50 developed and emerging countries. When a global panic hits and your VIX trigger is activated, you can deploy capital into this single instrument. This allows you to bet on the global economic recovery as a whole, capturing the rebound wherever it occurs strongest, without needing to pick individual stocks or countries.
The next market panic is not a question of ‘if’, but ‘when’. Your work begins now: build your wish list, define your triggers, and prepare your capital. The greatest transfers of wealth occur when assets are forced from the hands of the panicked into the portfolios of the prepared. Ensure you are on the right side of that transaction.